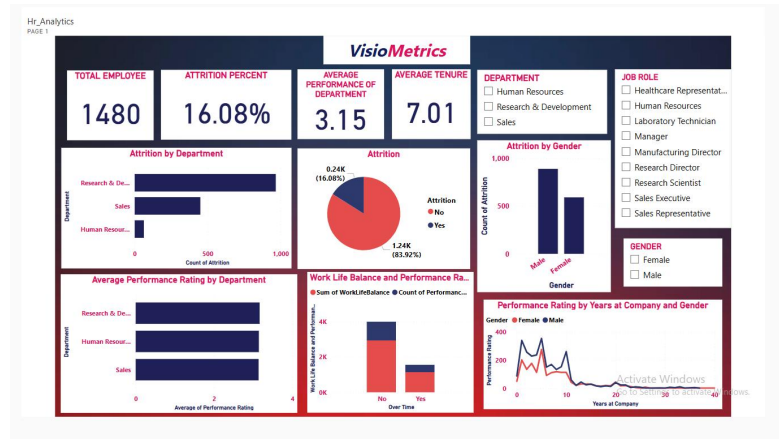
HR Analytics Dashboard of VisoMetrics
•Cleaned & validated 1,500+ employee records using SQL & Excel
•Standardized 15+ attributes (tenure, scores, roles) using Python
•Built 20+ DAX measures in Power BI for attrition & performance trends
•Identified 16% attrition in key departments; proposed strategies for 10% reduction
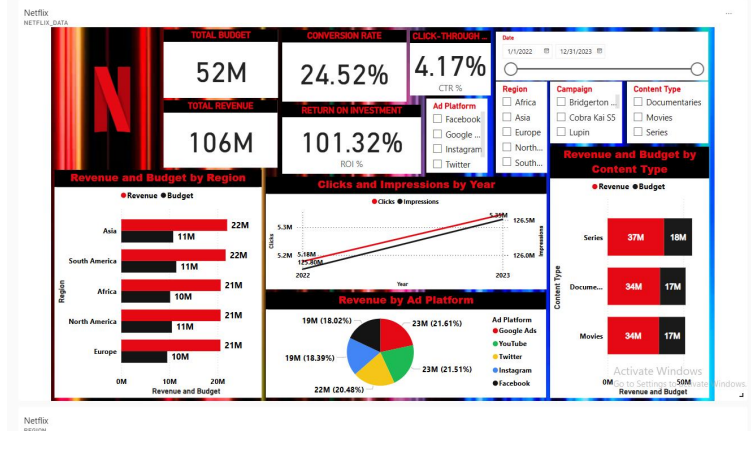
Marketing Campaign Dashboard of Netflix
•Created Power BI dashboard to analyze campaign data across regions
•Ensured accuracy by validating multi-source data with SQL & Excel
•Measured KPIs: ROI (101.32%), CTR (4.17%), engagement metrics
•Automated reporting boosted optimization efficiency by 20%
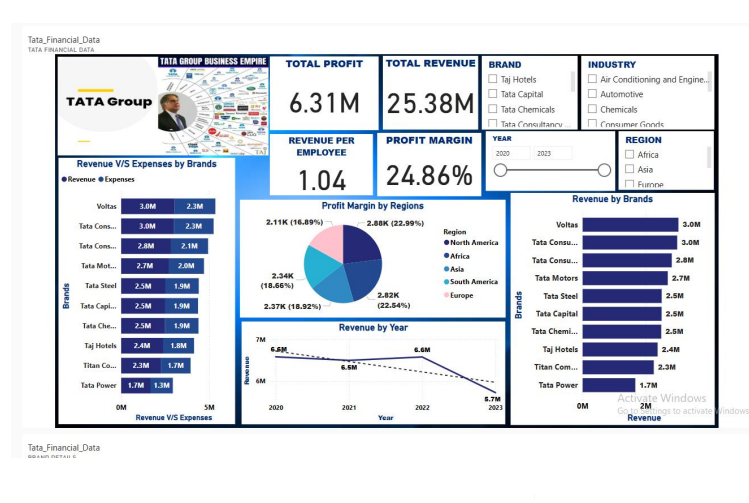
Financial Performance Dashboard of TATA Group's
•Processed 500+ records across 10 Tata brands for financial analysis
•Cleaned & standardized 16+ financial attributes using Python
•Built Power BI dashboard with 10+ dynamic DAX metrics
•Improved operational efficiency by 15% via revenue & expense tracking
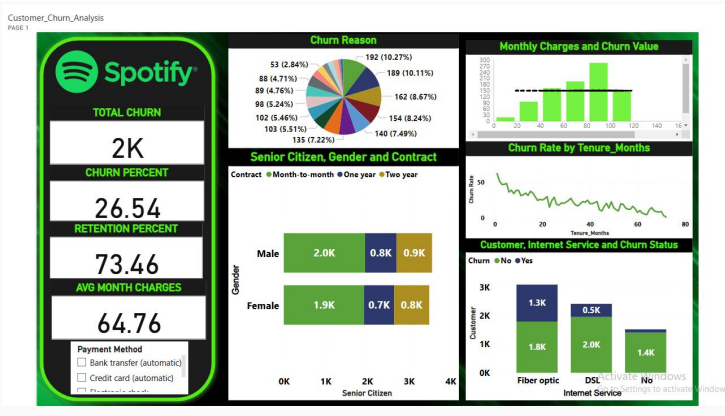
Customer Churn Analysis Dashboard of Spotify
•Analyzed 1K+ customer records for churn behavior
•Cleaned & transformed 15+ attributes using Python & SQL
•Created Power BI dashboard with real-time churn/retention metrics
•Highlighted fiber-optic & month-to-month churn risks; enabled 20% retention improvement
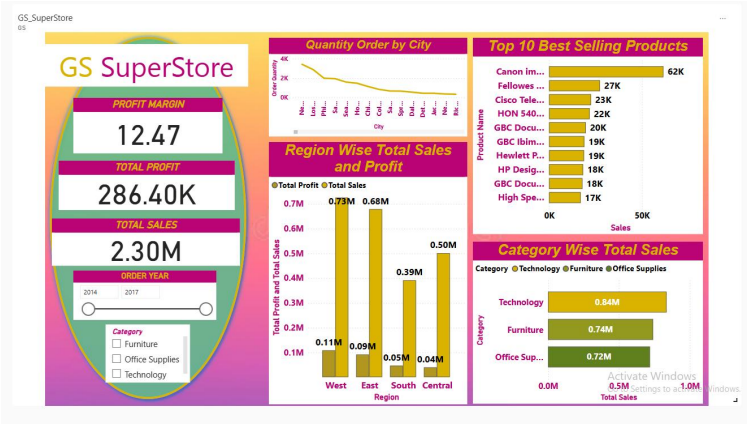
GS SuperStore Sales Dashboard
•Analyzed 500+ in sales data to gain insights into profitability, product performance, and regional sales distribution.
•Employed diagnostic techniques to break down sales by category and region, pinpointing the Central region as the sales leader and Technology as the top-grossing category.
•Created a dynamic dashboard to visualize key financial metrics like total sales ($2.30M) and profit ($286.40K) with a 12.47% margin.
•Identified top performers such as the "Canon Im..." product with 62K in sales and the West region with the highest profit, enabling targeted business strategies.